Showing posts with label example. Show all posts
Showing posts with label example. Show all posts
Saturday, February 14, 2015
New Mobile Product Sales Dashboard 3 Example in Pentaho CDE
Hi Guys,
Here is the new dashboard work out in Pentaho CDE.
High lights of the dashboard:
1) Bar Chart with Trend Line
2) Stacked Bar chart with Trend lines + Line Chart.
3) Submit Button for input controls after selection.
4) Export charts to jpg images.
5) Reload with default inputs
6) Navigation (Home button) to Parent Dashboard(if we assume this as one of the child dashobards).
7) Mobile/iPad/laptop/Desktop comparability.
laptop View:


Share a sample data of yours ...!!! Ill give you the meaning of it.
References :
1) http://www.webdetails.pt/ccc2/
2) http://www.webdetails.pt/ctools/ccc.html
Thank you.
Sadakar
BI developer (Japser/Petnaho/Talend ETL).
Here is the new dashboard work out in Pentaho CDE.
High lights of the dashboard:
1) Bar Chart with Trend Line
2) Stacked Bar chart with Trend lines + Line Chart.
3) Submit Button for input controls after selection.
4) Export charts to jpg images.
5) Reload with default inputs
6) Navigation (Home button) to Parent Dashboard(if we assume this as one of the child dashobards).
7) Mobile/iPad/laptop/Desktop comparability.
laptop View:
Mobile View:
Share a sample data of yours ...!!! Ill give you the meaning of it.
References :
1) http://www.webdetails.pt/ccc2/
2) http://www.webdetails.pt/ctools/ccc.html
Thank you.
Sadakar
BI developer (Japser/Petnaho/Talend ETL).

Thursday, February 12, 2015
Drill down from one dashboard to another dashboard in Pentaho CDE Simple Example Not included any parameters
Hi Guys,
This post will teach you how you can drill down from one dashboard to another dashboard in pentaho CDE. This workout has done by one of my colleagues who is a fast learner.
You need to focus on 2 things in this post:
1) Connecting to JDBC datasource
2) Drill down from one dashboard to another dashboard.
NOTE :
Ill update you in next post about drill down from one dashboard to another dashboard using custom parameters concept.(Next work out).
Versions & Tools used for this post:
Pentaho C-Tools(CDE,CDA,CDF) 13.09 stable.
PostgreSQL DB - (foodmart database - which is one of jasperserver default databases)
Pentaho BA server 4.8 stable.
SOURCE CODE OF THE EXAMPLE
Download the example using below link
https://drive.google.com/file/d/0BymV_QP4TGBEZ0p1cnpydDJGeDQ/edit?usp=sharing
Deployment procedure:
1) Down load the .rar file from the link(File-Download in the google drive)
2) Unzip it and place it in "pentaho-solutions" folder.
3) Refresh or clear the cache of the pentaho browser(find upper left - Browser)
4) If you are unable to find the folder name , you need to create an index.xml file (Eg: you can find it inside any folder. copy and paste it inside your working folder and change the name of it).
5) No need to restart the pentaho server.
NOTE: Edit data base connections as per your requirement also you may need to change the query if you use any other database than foodmart
Dashboard 1:
1) Layout section
* Design your lay out for dashboard1
2) Components section
* You will be placing 1 bar chart where you will click on bars for drilling down to another dashboard.
We will come back to this section again after designing Dashboard 1 and Dashboard 2
3) Data Sources section
* Click on Data source Icon on right top conrner.
* From the left .. click on SQL queries -> Click on sql over sqljdbc
* Give the name and all the properties as shown in below image.

NOTE:
PostgreSQL server default details :
Driver: org.postgresql.Driver
UserName : postgres
Password : postgres
URL: jdbc:postgresql://localhost:6062/foodmart where 6062 is the port number which I used for postgres and foodmart is the database.
Note that default port number for postgresSQL is 5432 .
* Write a query which will suits for bars in the chart
* For eg:
SELECT
c.country,
c.state_province ,
c.city,
SUM(sf.store_sales)
FROM
customer c,
sales_fact_1997 sf
WHERE c.customer_id=sf.customer_id
GROUP BY
c.country,
c.state_province,
c.city
ORDER BY
c.country,c.state_province,c.city
* See the preview of the dashboard
* Out put will looks like below.

Dashboard 2 :
* Repeat the same steps as followed in Dashboard 1
* Take any component to display on the second dashboard.
* I have taken table component in this example and the output will looks like below mentioned image.
*

We have done with 2 dashboards individually.
Now, Its the time for us to some trick on Dashboard 1 so that when we click on Dashboard 1 , it will have to take you to Dashboard2
Steps:
1) Lets go back to Dashboard 1
2) Go to the Chart component and in the properties give clickable as True
3) In the clickAction you need to give the URL of second dashboard in java script.
Eg:
function q(s,c,v)
{
window.location = http://localhost:8085/pentaho/content/pentaho-cdf-dd/Render?solution=CDE-+Exploring&path=%2FDevelopement%2FDashboard+Drill+down&file=drill_down_to_table.wcdf;
}
Thats it you have done with drill down. Save the dashboard 1 and see the preview and then click on any bar appearing , you will navigate to the 2nd dashboard.
NOTE :
This post is only giving the idea of how to drill down from one dash board to another dashboard.
This post doesnt work with any parameters. The use custom parameter with drill down from 1 dashboard to another dashboard will come in next post from my end.
URL generating problem / Path problem for Second Dashboard
How to generate the URL for 2nd dashboard ( not only for this but also works for every dashboard).?
* Right click on 2nd Dashboard and click on "Open In New Tab" the with the URL the 2nd dashboard will open in fresh tab.
* Copy that URL and paste in drill down function.
* For eg : Just reference : Find the images below


References :
1) http://forums.pentaho.com/showthread.php?152634-Drill-down-from-bar-chart-to-another-dashboard
2) http://forums.pentaho.com/showthread.php?82999-Drill-Down-in-DashBoards
Sadakar
("Learning never exhausts the mind")
This post will teach you how you can drill down from one dashboard to another dashboard in pentaho CDE. This workout has done by one of my colleagues who is a fast learner.
You need to focus on 2 things in this post:
1) Connecting to JDBC datasource
2) Drill down from one dashboard to another dashboard.
NOTE :
Ill update you in next post about drill down from one dashboard to another dashboard using custom parameters concept.(Next work out).
Versions & Tools used for this post:
Pentaho C-Tools(CDE,CDA,CDF) 13.09 stable.
PostgreSQL DB - (foodmart database - which is one of jasperserver default databases)
Pentaho BA server 4.8 stable.
SOURCE CODE OF THE EXAMPLE
Download the example using below link
https://drive.google.com/file/d/0BymV_QP4TGBEZ0p1cnpydDJGeDQ/edit?usp=sharing
Deployment procedure:
1) Down load the .rar file from the link(File-Download in the google drive)
2) Unzip it and place it in "pentaho-solutions" folder.
3) Refresh or clear the cache of the pentaho browser(find upper left - Browser)
4) If you are unable to find the folder name , you need to create an index.xml file (Eg: you can find it inside any folder. copy and paste it inside your working folder and change the name of it).
5) No need to restart the pentaho server.
NOTE: Edit data base connections as per your requirement also you may need to change the query if you use any other database than foodmart
Dashboard 1:
1) Layout section
* Design your lay out for dashboard1
2) Components section
* You will be placing 1 bar chart where you will click on bars for drilling down to another dashboard.
We will come back to this section again after designing Dashboard 1 and Dashboard 2
3) Data Sources section
* Click on Data source Icon on right top conrner.
* From the left .. click on SQL queries -> Click on sql over sqljdbc
* Give the name and all the properties as shown in below image.
NOTE:
PostgreSQL server default details :
Driver: org.postgresql.Driver
UserName : postgres
Password : postgres
URL: jdbc:postgresql://localhost:6062/foodmart where 6062 is the port number which I used for postgres and foodmart is the database.
Note that default port number for postgresSQL is 5432 .
* Write a query which will suits for bars in the chart
* For eg:
SELECT
c.country,
c.state_province ,
c.city,
SUM(sf.store_sales)
FROM
customer c,
sales_fact_1997 sf
WHERE c.customer_id=sf.customer_id
GROUP BY
c.country,
c.state_province,
c.city
ORDER BY
c.country,c.state_province,c.city
* See the preview of the dashboard
* Out put will looks like below.
Dashboard 2 :
* Repeat the same steps as followed in Dashboard 1
* Take any component to display on the second dashboard.
* I have taken table component in this example and the output will looks like below mentioned image.
*
We have done with 2 dashboards individually.
Now, Its the time for us to some trick on Dashboard 1 so that when we click on Dashboard 1 , it will have to take you to Dashboard2
Steps:
1) Lets go back to Dashboard 1
2) Go to the Chart component and in the properties give clickable as True
3) In the clickAction you need to give the URL of second dashboard in java script.
Eg:
function q(s,c,v)
{
window.location = http://localhost:8085/pentaho/content/pentaho-cdf-dd/Render?solution=CDE-+Exploring&path=%2FDevelopement%2FDashboard+Drill+down&file=drill_down_to_table.wcdf;
}
Thats it you have done with drill down. Save the dashboard 1 and see the preview and then click on any bar appearing , you will navigate to the 2nd dashboard.
NOTE :
This post is only giving the idea of how to drill down from one dash board to another dashboard.
This post doesnt work with any parameters. The use custom parameter with drill down from 1 dashboard to another dashboard will come in next post from my end.
URL generating problem / Path problem for Second Dashboard
How to generate the URL for 2nd dashboard ( not only for this but also works for every dashboard).?
* Right click on 2nd Dashboard and click on "Open In New Tab" the with the URL the 2nd dashboard will open in fresh tab.
* Copy that URL and paste in drill down function.
* For eg : Just reference : Find the images below
References :
1) http://forums.pentaho.com/showthread.php?152634-Drill-down-from-bar-chart-to-another-dashboard
2) http://forums.pentaho.com/showthread.php?82999-Drill-Down-in-DashBoards
Sadakar
("Learning never exhausts the mind")
Wednesday, January 28, 2015
CSS3 Rounded Corners and Box Shadows Example
In this tutorial we going to take look of some nice features in CSS3 provide rounded corners, drop shadows and few new color management features. It doesn’t matter if your are developer or designer at the end of the day our job is basically same we have to create rich, usable website and web application with an awesome user experience.
First we will see how to create rounded corner. Rounded corners are nothing but rounds the corner(s) of an element with a defined radius value. I have taken three div tags and each div has a different border class . Look at the top div the border radius property is 20px and applied same pixel to all the four corners. We can also specify amount in percentage for example 1%. If you want to define different border radius on each corner look the second div and last div contains the individual border property.
 div {
      font-family: verdana, arial;
      font-size: small;
      padding: 10px;
      width: 400px;
      height: 50px;
      background-color: orange;
    }

    .borderEffect1 {
      border-radius: 20px;
    }

    .borderEffect2 {
      /* top-left top-right bottom-right bottom-left */
      border-radius: 10px 50px 10px 0px;
    }

    .borderEffect3 {
      border-top-left-radius: 10px;
      border-top-right-radius: 50px;
      border-bottom-right-radius: 10px;
      border-bottom-left-radius: 0px;
    }

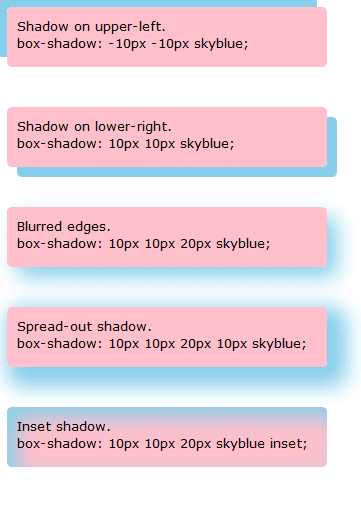
Box shadow is a new property in CSS3. It takes five values horizontal offset the positive number means up shadow and negative number means down shadow, vertical offset, blur distance, spread distance, color, and inset. I have taken series of div tags and applied shadow class for each div.
 div {
      font-family: verdana, arial;
      font-size: small;
      padding: 10px;
      width: 300px;
      height: 40px;
      background-color: pink;
      border-radius: 5px;
    }

    .dropShadow1 {
      box-shadow: -10px -10px skyblue;
    }

    .dropShadow2 {
      box-shadow: 10px 10px skyblue;
    }

    .dropShadow3 {
      box-shadow: 10px 10px 20px skyblue;
    }

    .dropShadow4 {
      box-shadow: 10px 10px 20px 10px skyblue;
    }

    .dropShadow5 {
      box-shadow: 10px 10px 20px skyblue inset;
    }
 |

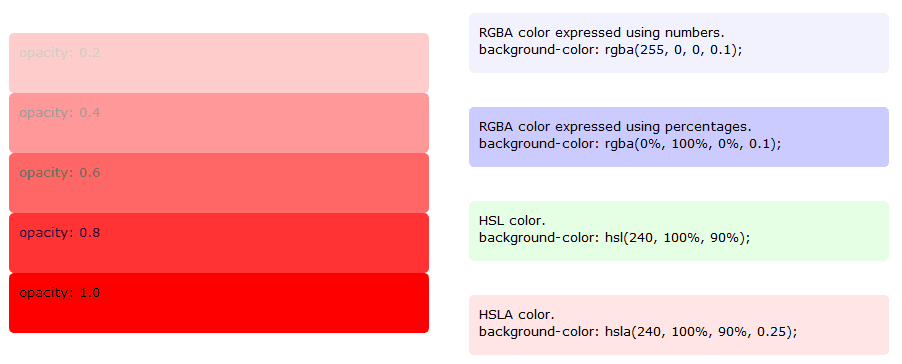
Color management is the new way to specify colors in CSS3. We have rgba or rgb and hsla or hsl function. RGBA is used to specify the colors red, blue, green and opacity. HSLA is used to specify Hue, Saturation, Lightness. RGBA and HSLA colors expressed using percentages or numbers. Once check the code in below example.
Opacity is another property in CSS3 used to set opacity.
div {
      font-family: verdana, arial;
      font-size: small;
      padding: 10px;
      width: 400px;
      height: 40px;
      border-radius: 5px;
    }

  .colorOpacity1 {
      background-color: rgba(255, 0, 0, 0.1);
    }

    .colorOpacity2 {
      background-color: rgba(0%, 100%, 0%, 0.1);
    }

    .colorOpacity3 {
      background-color: hsl(240, 100%, 90%);
    }

    .colorOpacity4 {
      background-color: hsla(240, 100%, 90%, 0.25);
    }
<div style="background: red; opacity: 0.0;">opacity: 0.0</div>
<div style="background: red; opacity: 0.2;">opacity: 0.2</div>
<div style="background: red; opacity: 0.4;">opacity: 0.4</div>
<div style="background: red; opacity: 0.6;">opacity: 0.6</div>
<div style="background: red; opacity: 0.8;">opacity: 0.8</div>
<div style="background: red; opacity: 1.0;">opacity: 1.0</div>
Subscribe to:
Posts (Atom)